
CS4PR Report - Seafest 2018
Summary
Complete Streets for Prince Rupert conducted a survey at Seafest, 2018. The survey found that people firstly choose to drive and secondly walk downtown. People also reported that protected bicycle paths and better visibility would make it easier to walk or cycle downtown.
Introduction
In 2017, there were 11 pedestrian-vehicle crashes in Prince Rupert including one fatality. 84% of Rupertites admitted feeling unsafe at crosswalks according to an online poll conducted by The Northern View newspaper. Clearly, there is a demand to improve safety for everyone who uses our roads.
Complete streets are streets that have been designed to be safe and accessible by people of all ages, abilities and modes of travel. Complete Streets for Prince Rupert (CS4PR) shared information at Seafest, 2018 about how other communities large and small have been making their streets safer for all road users by implementing simple and economical street redesigns. CS4PR also received the opinions of locals who use our streets every day. We hope the information we collected will help move citizens and local planners to create safer, more accessible and more enjoyable streets for everyone in Prince Rupert.
Methods
CS4PR set up an information booth on Sunday afternoon at Kwinitsa Waterfront Park during Seafest, 2018. People who approached the booth were invited to complete a mobility- and safety-related survey. Survey respondents were offered a chance to win one of two child’s bicycles. Both bicycles were donated by Chucky’s Cycle Shop in Prince Rupert.
The survey consisted of two questions: 1) How do you usually get downtown? [Drive, Walk, Bicycle, Bus, Taxi, Mobility aid, Other] and 2) What would make it easier to walk or cycle downtown? [More bus shelters, Slower vehicle speeds, Protected bicycle paths, Better sidewalks with wheelchair dips, Better visibility, More bicycle parking, Shorter crosswalks, Nothing. Everything is fine., Other]. Survey participants were allowed to state their first and second preference to each question by placing a green #1 sticker beside their first choice and a blue #2 sticker beside their second choice. For example, for question 1, a participant might place a green #1 sticker beside Driving (to denote they mostly drove downtown) and a blue #2 sticker beside Walk (to denote they sometimes walked downtown). For question 2, a participant might place a green #1 sticker beside Protected bike paths (to denote their first choice) and a blue #2 sticker beside Better visibility (to denote their second choice).
Participants also had the option of putting small red stickers on a map of the city to contribute to the list of spots Rupertites think are 'dangerous by design' (see bottom of page for interactive map).
Participants
A total of 99 people participated in the survey. The beautiful weather, and a variety of free entertainment attracted a wide variety of people to the waterfront on Sunday afternoon. Survey participants appeared to represent many walks of life (from middle school students to elders) and abilities (from people who use wheelchairs to people who walk, drive and cycle).
Results
(click on graphs to enlarge)


Discussion
Question #1 asked how people usually get downtown. No surprise here. People’s most usual way to travel downtown is by car followed by walking. Although 99 people responded to question #1, some people chose not to place a second sticker to describe how they sometimes arrived downtown. This explains why there are fewer total responses for how people sometimes get downtown. These respondents were drivers who explained that the only mode of transportation they use to get downtown is their personal vehicle.
Some people who responded that walking was their number one way to get downtown mentioned that they did not own a car or they lived downtown and driving was not necessary. Walking was also the mode that most people reported sometimes using to get downtown. One astute survey participant brought to our attention that the low number of people who reported taking the bus may have been due to the fact that there is no bus service on Sunday (the day of the survey). That is, people who rely on the bus for transportation may not have been able to attend the Seafest festivities and participate in our survey.
Question #2 asked about participants' preferred strategy for making it easier to walk or cycle downtown. The question gave people the choice of focusing on either walking or cycling. We find it interesting that protected bicycle paths were people’s most popular safety intervention for several reasons:
- Protected bicycle paths was the most popular choice for making it easier to walk or cycle downtown even though the majority of people get downtown by car or on foot and relatively few people cycle
- Despite walking being people’s second most preferred way to get downtown, most people chose an intervention that on the surface might appear to benefit only people who ride bicycles
- Protected bicycle paths may have been the most popular intervention because many people want to ride bicycles, but feel too afraid to do so because of the danger of having to share space with moving vehicles
- It could also be that people who drive realized that creating protected bicycle paths makes it safer and more comfortable for cycling and for driving. At the moment, people who cycle and people who drive are forced to share the same road space. Some people who drive in Prince Rupert reported feeling nervous passing a person riding a bicycle on the street. Protected cycling infrastructure makes it safer and more comfortable for cyclists and drivers because conflicts over shared space are reduced. Protected bicycle paths also discourage people from riding bicycles on the sidewalks, thereby reducing conflicts with people who walk
- It appears that despite relatively few people who cycle, Rupertites have an appetite for better cycling infrastructure.

Image source: NACTO
Choosing not to build safer infrastructure for cycling on the grounds that so few people use bicycles is a self-fulfilling prophecy. This attitude discourages the use of bicycles and ignores the reality that many people will choose a bicycle as a mode of transportation when they feel it is safe to do so.
Building better sidewalks with wheelchair dips was the runner up after protected bicycle paths. Some people who chose this safety strategy mentioned how difficult it is to access sidewalks while pushing a baby stroller or using a wheelchair because wheelchair dips are not available or are inaccessible.
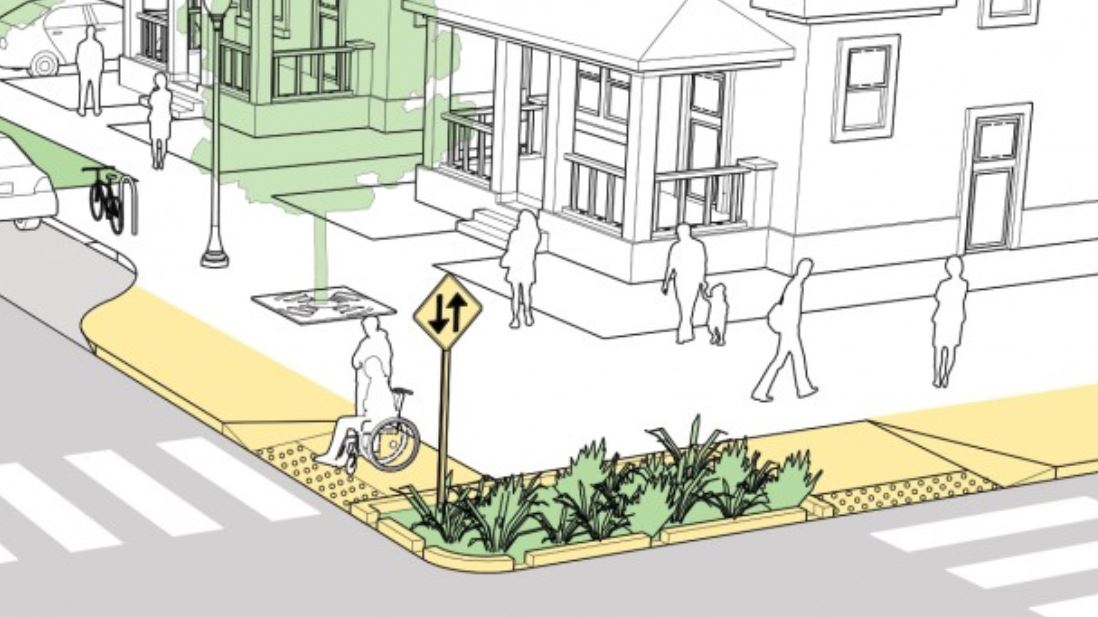
Image source: NACTO
People’s most popular second choice for making it easier to walk and cycle downtown was better visibility. Many drivers reported that vehicles parked (legally) close to crosswalks make it difficult to see pedestrians waiting to cross the street. Similarly, many walkers mentioned how difficult it is to see around vehicles parked close to the crosswalk. Curb extensions reduce pedestrian-related crashes because they improve visibility for walkers and drivers, they make crossings shorter and they reduce vehicle speeds. Curb extensions on key crossings would address several popular wishes from the survey.
Limitations
Two limitations of this survey were the relatively low number of responses (less than 1% of the population) and that the participants do not represent a random sampling of the population. For example, people who already have an interest in safe mobility or people who are interested in winning a bicycle may have been attracted to the booth to fill out the survey. Being interested in winning a child’s bicycle may have made some survey participants more aware of the safety issues facing people who ride bicycles and thus influenced some people’s desire for protected bicycle paths.
Conclusion
This study found that survey participants primarily drive and walk downtown and that participants feel installing protected bicycle paths and improving visibility would make it easier to walk or cycle downtown. Cities large and small are proving that when streets are made safer for people who walk, cycle and use wheelchairs, the whole community benefits. We hope that the results of this preliminary survey ignite community interest in creating safer, more accessible and more enjoyable streets for everyone. In the words of one Twitter user, “The future of PR is great. Keep planning for it to be the most liveable coastal city in BC.”
(Banner photo credit: Shannon Lough)